Using datatool and TikZ to generate figures from data
Or just use print screen and MS Paint, you know, what ever is easiest...

If you’re not already using PGF and TikZ for figures in your LaTeX documents, I suggest you take a few evenings and get acquainted with a number of examples, so you can grasp the magnitude of its’ capability—you certainly won’t be disappointed.
Building static diagrams and graphs (adding PGFPlots into the mix) is fine, but I find myself constantly wanting decent plots from real data, that don’t fit the usual line/surface paradigm. The datatool package is perfect for this kind of work.
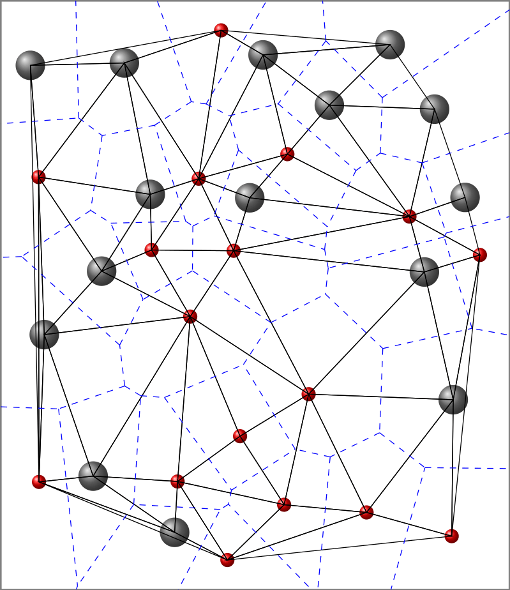
Something I’m working on currently is the classification of voids in amorphous solids, voronoi networks seem to be a great way of expressing the arrangement of atoms in these systems. The following example uses an amorphous aluminium oxide and is represented in 2D so as not to complicate the problem too much.
To simplify things further, I’ve separated my input data into three csv files that look something like this:
1,Al,10.331817,36.323166,1.250000
2,Al,5.092404,21.862188,1.250000
3,Al,2.332884,23.765770,1.250000
4,Al,13.550237,30.676344,1.250000
5,Al,0.676694,28.555687,1.250000
6,Al,14.927469,33.200344,1.250000
7,Al,4.266311,33.304264,1.250000
8,Al,7.634949,33.187614,1.250000
...
The datatool package reads this information in through its load database command \DTLloaddb
\DTLloaddb[noheader,keys={idx,species,x,y,r}]{data}{data2Dtest.csv}
pulling the file into the data variable, and assigning keys to each column. Now using a foreach command to loop over all rows in data,
\DTLforeach*{data}{\idx=idx, \species=species, \x=x, \y=y, \r=r}
I can draw a circle of radius \r at position (\x,\y); as well as color each circle depending on its associated \species key [lines 23–30 in the full code below].
Two other functions of datatool that I use in this example are extremely useful:
\DTLcomputebounds{data}{x}{y}{\minX}{\maxX}{\minY}{\maxY}
computes the bounds of the (x,y) data, which I use to draw a bounding box;
\DTLgetvalueforkey{\oneX}{x}{data}{idx}{\one}
grabs the location of x from data at idx, where that index value equals \one from another data set.
If you include all of this with some TikZ trickery, it’s fairly simple to generate a number of figures like this incredibly fast with a myriad of different data sets.
The entire code-set for this project is below. The in-line comments expand on the syntax I outline above and should answer most questions you may have about each functions purpose.
% generates a 2D voronoi diagram from input files in tikz
\documentclass{article}
\pagestyle{empty}
\usepackage{tikz}
\usepackage{datatool}
\usepackage{graphicx}
\DTLloaddb[noheader,keys={idx,species,x,y,r}]{data}{data2Dtest.csv} %CSV data
\DTLloaddb[noheader,keys={one,two,three}]{tri}{tri2Dtest.csv} %delaunay triangulation data
\DTLloaddb[noheader,keys={vxx,vxy,vyx,vyy}]{vor}{vor2Dtest.csv} %voronoi data
\usetikzlibrary{calc,fadings}
%To save output, uncomment next three lines (Third only to force recompile).
%Then execute with pdflatex -shell-escape voronoi2D.tex
%\usetikzlibrary{external}
%\tikzexternalize % activate!
%\tikzset{external/force remake}

\begin{document}
%\begin{figure}
%\resizebox{\textwidth}{!}{

\begin{tikzpicture}[scale=0.5]
%Draw Atoms
\DTLforeach*{data}{\idx=idx, \species=species, \x=x, \y=y, \r=r}{
    %Choose color based on species, draw circle at current point
    \ifthenelse{\pdfstrcmp{\species}{Al}=0}{
    \shade[ball color=gray] (\x,\y) circle(0.4*\r);
    }{
    \shade[ball color=red] (\x,\y) circle(0.4*\r);
    }
}

%Draw Delaunay Simlpexes
\DTLforeach*{tri}{\one=one, \two=two, \three=three}{
    %One, two and three are indexes of the corners of each D triangle
    %Get locations from \x & \y in data db for each index
    \DTLgetvalueforkey{\oneX}{x}{data}{idx}{\one}
    \DTLgetvalueforkey{\oneY}{y}{data}{idx}{\one}
    \DTLgetvalueforkey{\twoX}{x}{data}{idx}{\two}
    \DTLgetvalueforkey{\twoY}{y}{data}{idx}{\two}
    \DTLgetvalueforkey{\threeX}{x}{data}{idx}{\three}
    \DTLgetvalueforkey{\threeY}{y}{data}{idx}{\three}
    %Draw triangle
    \draw (\oneX,\oneY) -- (\twoX,\twoY) -- (\threeX,\threeY) -- cycle;
}

%Draw Bounding Box
%Grab max/min of coords
\DTLcomputebounds{data}{x}{y}{\minX}{\maxX}{\minY}{\maxY}
%Draw Box
\draw[gray, thick] ({\minX-1},{\maxX-1}) rectangle ({\minY+1},{\maxY+1});
%Set clipping path for voronoi data
\clip ({\minX-1},{\maxX-1}) rectangle ({\minY+1},{\maxY+1});

%Draw Voronoi cells
\DTLforeach*{vor}{\vxx=vxx, \vxy=vxy, \vyx=vyx, \vyy=vyy}{
    %Draw line
    \draw[blue,dashed] (\vxx,\vyx) -- (\vxy,\vyy);
}
\end{tikzpicture}
%\end{figure}

\end{document}